

| Today | Sunday | Monday | Tuesday | Wednesday | Thursday | Friday |
|---|---|---|---|---|---|---|
| | | | | | | |
| 77° F | 78° F | 74° F | 74° F | 83° F | 88° F | 88° F |
| 2 to 6 mph S | 6 to 9 mph E | 8 mph E | 7 mph SE | 3 to 10 mph W | 5 to 10 mph W | 3 to 8 mph W |
| Showers And Thunderstorms | Mostly Cloudy then Slight Chance Light Rain | Chance Light Rain then Slight Chance Rain Showers | Showers And Thunderstorms | Sunny | Sunny | Partly Sunny |
| Tonight | Sunday Night | Monday Night | Tuesday Night | Wednesday Night | Thursday Night | |
| | | | | | | |
| 63° F | 62° F | 62° F | 62° F | 64° F | 67° F | |
| 6 mph N | 6 to 9 mph E | 5 to 8 mph SE | 3 to 7 mph SW | 5 to 9 mph W | 3 to 8 mph W | |
| Chance Showers And Thunderstorms then Mostly Cloudy | Chance Light Rain | Chance Rain Showers | Showers And Thunderstorms | Mostly Clear | Partly Cloudy |
NO CURRENT WATCHES, WARNINGS, AND ADVISORIES FOR EASTERN BERGEN (NJZ104) NJ
CURRENT WEATHER CONDITIONS IN THE N.Y.C. REGION
The map window below is refreshed every 10 minutes

The weather data shown above comes from MADIS ( Meteorological Assimilation Data Ingest System ). MADIS collates data from federal, state and local agencies and then makes it available for public use. The MADIS data I use comes primarily from the New Jersey Weather and Climate Network and the Automatic Packet Reporting System ( APRS ). The round icons display current temperatures (°F). When the temperature icon equals or exceeds 90°F it turns red. Temperatures at or below 32°F are shown as blue. These stations range from Ocean City, Maryland to Provincetown, Massachusetts. This map was created primarily to help track the rain / snow line ( the 32°F isotherm ) as winter northeasters move up along the coast. It is also possible to see the cooling effect of sea breezes on coastal sites during the summer. Additional weather data for each station can be accessed in a pop-up table by clicking on the round temperature icons. These data are updated every 10 minutes. If you want to view this weather info in table form, click on the NYC MADIS TABLE tab located in the left sidebar.
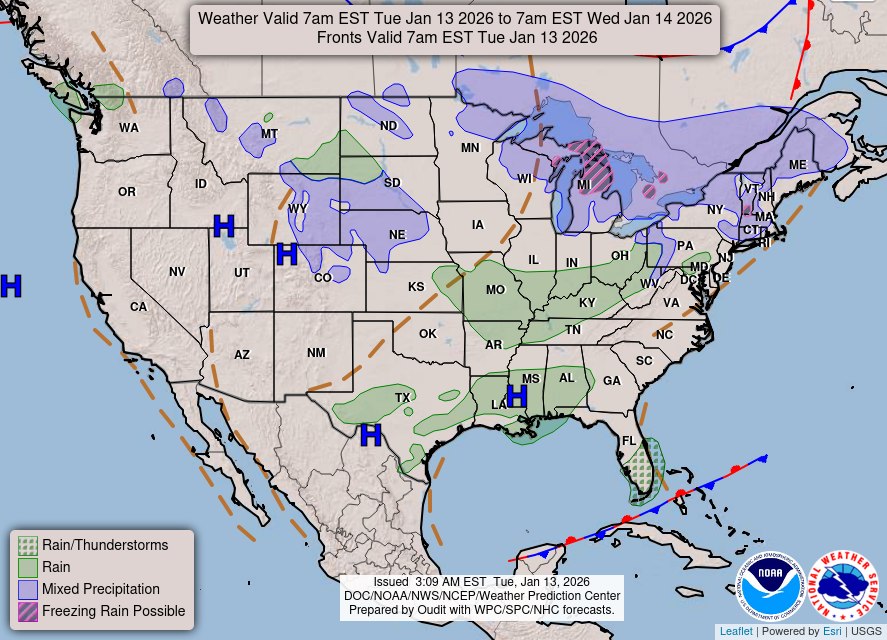
THE DAILY WEATHER MAP
WEATHER SUMMARY FOR MAY 2025
TEMPERATURES NORMAL... PRECIPITATION ABOVE NORMAL
Temperatures were exactly normal here in Bergenfield during
this past May with an average of 62.4°F (16.9°C). A maximum temperature of
87°F (30.6°C) was reached on the 3rd. The minimum of 45°F (7.2°C)
was recorded on the 1st.
Precipitation was above normal at 5.54" (140.7mm).
Rain was noted every day from the 3rd to the 10th, but all-in-all it was a rather uneventful month
weather-wise in the N.Y.C. region. A tornado with wind gusts of 100-105mph did strike to our
south in Gloucester and Atlantic counties resulting in downed tree branches and roof damage on the
16th.
No new daily records were recorded for the month.